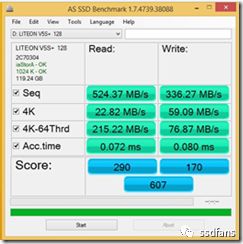
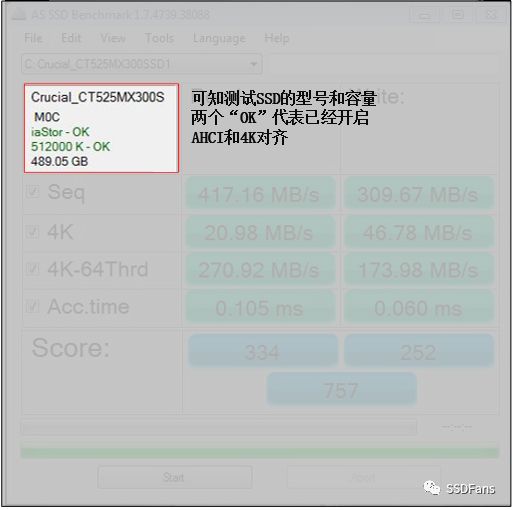
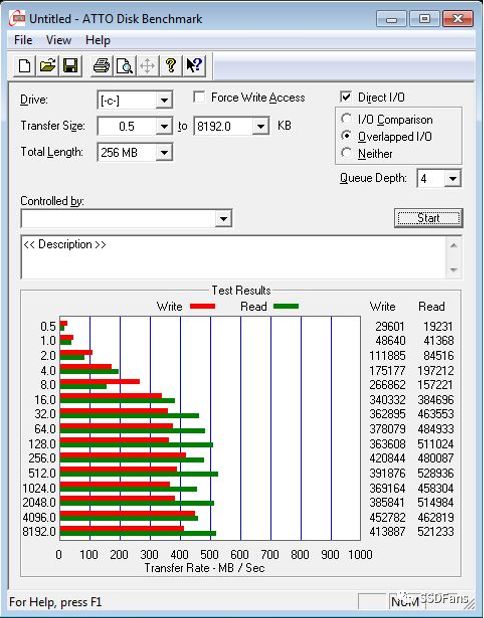
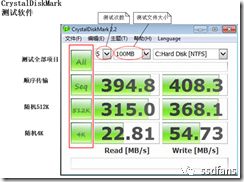
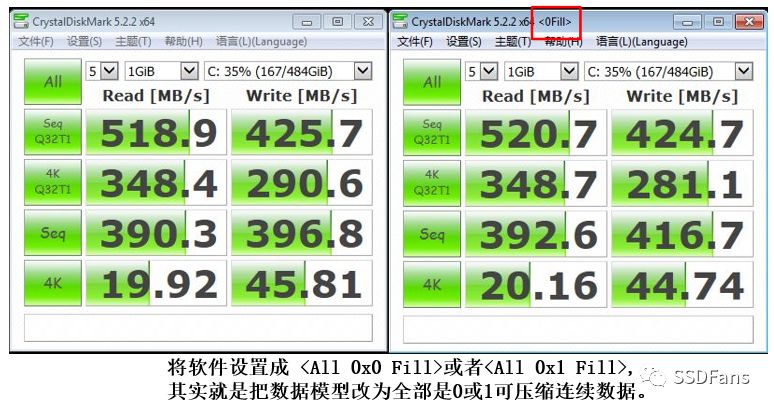
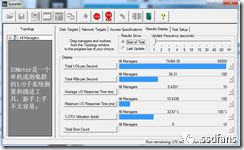
The first artifact of SSD performance testing-FIO For SSD performance testing, the best tool is FIO. FIO author Jens Great God The name of this lovely guy in the picture is Jens Axboe. He is a student who has not graduated from the Department of Computer Science at the University of Copenhagen in Denmark. He also has a famous fellow named Linus. He did not expect that the fellow would later become his leader. Jens is 40 years old this year (2017). He started working with Linux at the age of 16, and later became a Linux developer. Now he is the Linux Kernel, responsible for the maintenance of the block device layer. This block device layer is the one that has the closest relationship with our SSD, connecting the upper file system and the lower device driver. He has developed many useful programs, such as Deadline in Linux IO Scheduler, CFQ Scheduler, and the famous ace testing tool FIO. Jens used to work for Fusion-IO, Oracle and other companies. Now at Facebook, Dumb heard that Facebook pays the highest salary to programmers in Silicon Valley. FIO is an open source testing tool developed by Jens with very powerful functions. This article only introduces some of the basic functions. Thread, queue depth, Offset, synchronous and asynchronous, DirectIO, BIO Before using FIO, you must first have some basic knowledge of SSD performance testing. Thread refers to how many read or write tasks are executing in parallel at the same time. Generally speaking, a core in a CPU can only run one thread at a time. If there is only one core, if you want to run multiple threads, you can only use time slices. Each thread runs for a period of time, and all threads use this core in turn. Linux uses Jiffies to represent how many time slices a second is divided into. Generally speaking, Jiffies is 1000 or 100, so the time slice is 1 millisecond or 10 milliseconds. Generally, it only takes a few microseconds for a computer to send a read and write command to the SSD, but it takes hundreds of microseconds or even milliseconds for the SSD to execute the command. If a read and write command is sent, and then the thread sleeps all the time, waiting for the result to come back to wake up the processing result, this is called synchronous mode. It is conceivable that the synchronization mode is a waste of SSD performance, because there are many parallel units in the SSD. For example, there are 8-16 data channels in a general enterprise-level SSD, and each channel has 4-16 parallel logic units (LUN, Plane). ), so 32-256 read and write commands can be executed at the same time. Synchronous mode means that only one of the parallel units is working, violent. In order to improve parallelism, SSD reads and writes adopt asynchronous mode in most cases. It just takes a few microseconds to send the command. After sending the thread, the thread will not wait there stupidly, but will continue to send the subsequent commands. If the previous command is executed, the SSD notification will tell the CPU through interrupt or polling, and the CPU will call the callback function of the command to process the result. The advantage of this is that dozens of hundreds of parallel units in the SSD can be assigned to work, and the efficiency has skyrocketed. However, in asynchronous mode, the CPU cannot send commands to the SSD indefinitely. For example, if the SSD reads and writes is stuck, it is possible that the system will keep sending commands, thousands or even tens of thousands. On the one hand, the SSD cannot handle it, and on the other hand, so many commands will take up memory. , The system also hangs up. In this way, a parameter called queue depth is brought. For example, the queue depth of 64 means that all commands sent by the system are sent to a queue of size 64. If it is full, it cannot be sent. After the previous read and write commands have been executed, there is a place in the queue to fill in the commands. An SSD or file has a size. When testing read and write, set the Offset to start the test from a certain offset address. For example, start from the offset address of offset=4G. When Linux reads and writes, the kernel maintains the cache, and the data is first written to the cache, and then written to the SSD in the background. When reading, the data in the cache is also read first. This speed can be accelerated, but once the power is off, the data in the cache is gone. So there is a mode called DirectIO, which skips the cache and directly reads and writes to the SSD. Linux reads and writes SSD and other block devices using BIO, Block-IO, which is a data structure that contains the logical address LBA of the data block, data size, and memory address. FIO first experience Generally, Linux systems come with FIO. If there is no or the version is too old, you must download the latest version of the source code from https://github.com/axboe/fio, compile and install it. Enter the main code directory and enter the following command to compile and install it. ./configure;make && make install Use the following command to view the help file: man fio Let's look at a simple example: fio -rw=randwrite -ioengine=libaio -direct=1 –thread –numjobs=1 -iodepth=64 -filename=/dev/sdb4 -size=10G -name=job1 -offset=0MB -bs=4k -name=job2 -offset=10G -bs=512 –output TestResult.log The meaning of each item can be found from the fio help document. The parameters here are explained as follows: fio: software name. -rw=randwrite: read and write mode, randwrite is a random write test, as well as sequential read read, sequential write write, random read randread, mixed read and write, etc. -ioengine=libaio: libaio refers to the asynchronous mode, if it is synchronous, use sync. -direct=1: Whether to use directIO. -thread: Use pthread_create to create threads, the other is to fork to create processes. The overhead of a process is larger than that of a thread, and thread testing is generally used. -Numjobs=1: Each job is 1 thread, and several threads are used here, and each task specified with -name will open several threads for testing. So the final number of threads = number of tasks * numjobs. -iodepth=64: the queue depth is 64. -filename=/dev/sdb4: write data to the disk /dev/sdb4 (block device). This can be a file name, partition or SSD. -size=10G: The amount of data written by each thread is 10GB. -name=job1: The name of a task, the name can be started at will, it does not matter if it is repeated. This example specifies job1 and job2, creates two tasks, and shares the parameters before -name=job1. The parameter after -name is unique to this task. -offset=0MB: start writing from offset address 0MB. -bs=4k: The data size contained in each BIO command is 4KB. The general 4KB IOPS test is set here. –Output TestResult.log: log output to TestResult.log. FIO result analysis Let's take a look at the results of a FIO test random read. The command is as follows, 2 tasks are tested in parallel, queue depth is 64, asynchronous mode, each task test data is 1GB, and each data block is 4KB. Therefore, this command is testing 4KB random read IOPS with two threads and a queue depth of 64. # fio -rw=randread -ioengine=libaio -direct=1 -iodepth=64 -filename=/dev/sdc -size=1G -bs=4k -name=job1 -offset=0G -name=job2 -offset=10G job1: (g=0): rw=randread, bs=4K-4K/4K-4K/4K-4K, ioengine=libaio, iodepth=64 job2: (g=0): rw=randread, bs=4K-4K/4K-4K/4K-4K, ioengine=libaio, iodepth=64 fio-2.13 Starting 2 processes Jobs: 2 (f=2) job1: (groupid=0, jobs=1): err=0: pid=27752: Fri Jul 28 14:16:50 2017 read: io=1024.0MB, bw=392284KB/s, iops=98071, runt= 2673msec slat (usec): min=6, max=79, avg = 9.05, stdev = 2.04 clat (usec): min=148, max=1371, avg=642.89, stdev=95.08 lat (usec): min=157, max=1380, avg=651.94, stdev=95.16 clat percentiles (usec): | 1.00th=[ 438], 5.00th=[ 486], 10.00th=[ 516], 20.00th=[ 564], | 30.00th=[ 596], 40.00th=[ 620], 50.00th=[ 644], 60.00th=[ 668], | 70.00th=[ 692], 80.00th=[ 724], 90.00th=[ 756], 95.00th=[ 796], | 99.00th=[ 884], 99.50th=[ 924], 99.90th=[ 1004], 99.95th=[ 1048], | 99.99th=[ 1144] lat (usec): 250=0.01%, 500=6.82%, 750=81.14%, 1000=11.93% lat (msec): 2=0.11% cpu: usr=9.09%, sys=90.08%, ctx=304, majf=0, minf=98 IO depths: 1=0.1%, 2=0.1%, 4=0.1%, 8=0.1%, 16=0.1%, 32=0.1%, >=64=100.0% submit: 0=0.0%, 4=100.0%, 8=0.0%, 16=0.0%, 32=0.0%, 64=0.0%, >=64=0.0% complete: 0=0.0%, 4=100.0%, 8=0.0%, 16=0.0%, 32=0.0%, 64=0.1%, >=64=0.0% issued: total=r=262144/w=0/d=0, short=r=0/w=0/d=0, drop=r=0/w=0/d=0 latency: target=0, window=0, percentile=100.00%, depth=64 job2: (groupid=0, jobs=1): err=0: pid=27753: Fri Jul 28 14:16:50 2017 read: io=1024.0MB, bw=447918KB/s, iops=111979, runt= 2341msec slat (usec): min=5, max=41, avg = 6.30, stdev = 0.79 clat (usec): min=153, max=1324, avg=564.61, stdev=100.40 lat (usec): min=159, max=1331, avg=570.90, stdev=100.41 clat percentiles (usec): | 1.00th=[ 354], 5.00th=[ 398], 10.00th=[ 430], 20.00th=[ 474], | 30.00th=[ 510], 40.00th=[ 540], 50.00th=[ 572], 60.00th=[ 596], | 70.00th=[ 620], 80.00th=[ 644], 90.00th=[ 684], 95.00th=[ 724], | 99.00th=[ 804], 99.50th=[ 844], 99.90th=[ 932], 99.95th=[ 972], | 99.99th=[ 1096] lat (usec): 250=0.03%, 500=27.57%, 750=69.57%, 1000=2.79% lat (msec): 2=0.04% cpu: usr=11.62%, sys=75.60%, ctx=35363, majf=0, minf=99 IO depths: 1=0.1%, 2=0.1%, 4=0.1%, 8=0.1%, 16=0.1%, 32=0.1%, >=64=100.0% submit: 0=0.0%, 4=100.0%, 8=0.0%, 16=0.0%, 32=0.0%, 64=0.0%, >=64=0.0% complete: 0=0.0%, 4=100.0%, 8=0.0%, 16=0.0%, 32=0.0%, 64=0.1%, >=64=0.0% issued: total=r=262144/w=0/d=0, short=r=0/w=0/d=0, drop=r=0/w=0/d=0 latency: target=0, window=0, percentile=100.00%, depth=64 Run status group 0 (all jobs): READ: io=2048.0MB, aggrb=784568KB/s, minb=392284KB/s, maxb=447917KB/s, mint=2341msec, maxt=2673msec Disk stats (read/write): sdc: ios=521225/0, merge=0/0, ticks=277357/0, in_queue=18446744073705613924, util=100.00% FIO will print statistics for each job. The last is the total value. We generally value total performance and latency. The first thing to look at is the final total bandwidth, aggrb=784568KB/s, which is 196K IOPS if 4KB is counted. Let's look at Latency again. Slat is the command time, slat (usec): min=6, max=79, avg= 9.05, stdev= 2.04 means the shortest time is 6 microseconds, the longest is 79 microseconds, the average is 9 microseconds, and the standard deviation is 2.04. clat is the command execution time, and lat is the total delay. It can be seen that the average delay of reading is about 571 microseconds. clat percentiles (usec) gives the statistical distribution of latency. For example, 90.00th=[684] means that 90% of the read command delays are within 684 microseconds. Use FIO for data verification FIO can be used to check whether the write data is wrong. Use -verify=str to select the verification algorithm. There are md5 crc16 crc32 crc32c crc32c-intel crc64 crc7 sha256 sha512 sha1 and so on. In order to verify, you need to use the do_verify parameter. If it is a write, then do_verify=1 means that the verification is read after the write is completed, which will occupy a lot of memory, because FIO will store the verification data of each data block in the memory. When do_verify=0, only the verification data is written, and no read verification is performed. When reading do_verify=1, the data read out will be checked for verification value. If do_verify=0, the data is read only and no check is performed. In addition, when verify=meta, fio will write a time stamp, logical address, etc. in the data block. At this time, verify_pattern can also specify the write data pattern. FIO other functions FIO is very powerful. You can view every function through man. There is also a web version of the help document https://linux.die.net/man/1/fio. FIO configuration file The previous examples are all tested with the command line, in fact, these parameters can also be written in the configuration file. For example, the content of the new FIO configuration file test.log is as follows: [global] filename=/dev/sdc direct=1 iodepth=64 thread rw=randread ioengine=libaio bs=4k numjobs=1 size=10G [job1] name=job1 offset=0 [job2] name=job2 offset=10G ;–End job file After saving, you only need fio test.log to execute the test task. Is it convenient? AS SSD Benchmark AS SSD Benchmark test indicators AS SSD Benchmark is a dedicated SSD test software from Germany, which can test continuous reading and writing, 4K alignment, 4KB random reading and writing and response time performance, and give a comprehensive score. There are also two modes available, namely MB/s and IOPS! AS SSD Benchmark will generate and write a total of 5GB test data files during the test. All three test transfer rate items are used to read and write these data files to convert speed. Its 4KB QD64 is mainly used to measure NCQ (Native Command Queuing, native command queue) gap. In IDE mode, it is no different from ordinary 4KB random. Since each test requires a certain amount of data to be read and written, the lower the performance of the hard disk, the longer the test will take. It is not suitable to run this test with a mechanical hard disk. It takes about 1 hour to complete the test. Addressing time test, read is a test addressing a random 4KB file (full disk LBA area), and writing is a test addressing a random 512B file (specified 1GB address range). Note that at least 2GB of free space is required to run the AS SSD benchmark. In addition to testing the performance of the SSD, AS SSD Benchmark can also detect the firmware algorithm of the SSD, whether the AHCI mode is turned on, whether 4K alignment is performed, etc. (as shown in Figure 7-3). It is currently a very widely used SSD testing software. The test data used by AS SSD Benchmark is random. ATTO Disk Benchmark ATTO Disk Benchmark is a simple and easy-to-use disk transfer rate detection software that can be used to detect the read and write rates of hard disks, U disks, memory cards and other removable disks. The software uses data test packets of different sizes. The data packets are read and written from 512B, 1K, 2K to 8K. After the test is completed, the data is expressed in the form of a histogram, reflecting the impact of different file size ratios on the disk speed. ATTO test is the continuous read and write performance of the disk under extreme conditions. The test model adopted has high compressibility. ATTO tests all 0 data by default. CrystalDiskMark CrystalDiskMark test indicators CrystalDiskMark software is a small tool for testing hard disks or storage devices. You can choose the size and number of tests for the storage device. The test items are divided into continuous transmission rate test (block unit 1024KB), random 512KB transmission rate test, random 4KB test, random 4KB QD32 (queue depth 32) test. CrystalDiskMark runs 5 times by default, with 1000MB of data each time, taking the best result. Before CrystalDiskMark software test, it will also generate a test file (the size depends on user settings). Generally speaking, the larger the setting, the less interference the data cache will play, and the result will reflect the true performance of the SSD, but the disadvantage is that it will seriously affect the durability of the SSD (writing too much data affects P/E). Therefore, the software default values ​​are adopted for general testing. CrystalDiskMark sets different filling patterns The default test data of the software is incompressible data. If or is selected in the setting options, the test results are quite different. In fact, the data model is changed to all compressible continuous data. This is the same as the ATTO test principle. The test results are quite good, but the actual reference significance is not great. After modifying the data model, there is an obvious feature, which will be directly marked on the title bar of the CDM (as shown in the figure). PCMark Vantage PCMark Vantage can measure the comprehensive performance of various types of PCs. From multimedia home entertainment systems to notebooks, from professional workstations to high-end gaming platforms, whether in the hands of professionals or ordinary users, you can understand them thoroughly in PCMark Vantage to maximize performance. The test content can be divided into the following three parts: 1. Processor test: Based on data encryption, decryption, compression, decompression, graphics processing, audio and video transcoding, text editing, web page rendering, mail function, processor artificial intelligence game test, contact creation and search. 2. Graphics test: Based on high-definition video playback, graphics processing, and game testing. 3. Hard disk test: use Windows Defender, "Alan Wake" game, image import, Windows Vista startup, video editing, media center use, Windows Media Player search and classification, and the startup of the following programs: Office Word 2007, Adobe Photoshop CS2 , Internet Explorer, Outlook 2007. IOMeter IOMeter application screenshot Local IO performance test Start the program and click the IOMeter icon on windows; Select a drive in the "Disk Targets" page; Select a required test item in the "AccessSpecifications" page; Set the "Update Frequency (Seconds)" on the "ResultsDisplay" page to set how often the test results are counted. If not set, not only will the test results not be displayed during the test, but there will also be no data in the test result file after the test ends; · Total I/Os per Second: Data access speed, the larger the value, the better. · Total MBs per Second: Data transmission speed, the larger the value, the better. · Average I/O Response Time: Average response time, the smaller the value, the better. · CPU Utilization: CPU usage, the lower the better. Click the "StartTests" button in the toolbar, select a test result output file and start a test (usually a test runs for 10 minutes); After the test is completed, click the button to stop all tests. View test results, because IOMeter does not provide a GUI tool for viewing test reports. You can use Excel to open the test result file "csv", and then use the Excel icon tool to organize the test results. Or use the "Import Wizard for MS Access" provided by IOMeter to import the test results into an Access file. 5V 2.4A Usb Charger,5V2.4A Adapter Usb Charger,Ul Usb Wall Charger,Ul 60950 Usb Wall Charger Guangdong Mingxin Power Technologies Co.,Ltd. , https://www.mxpowersupply.com
