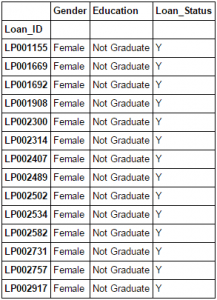
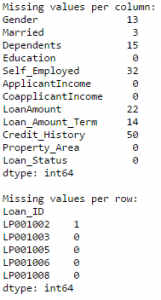
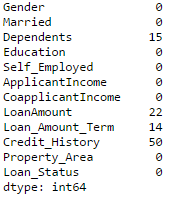
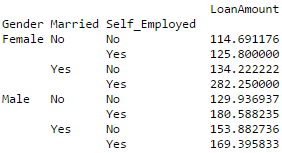
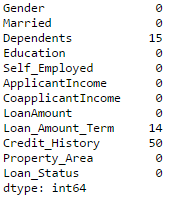
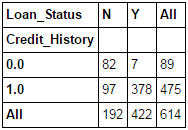
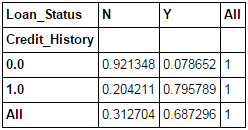
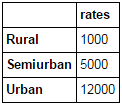
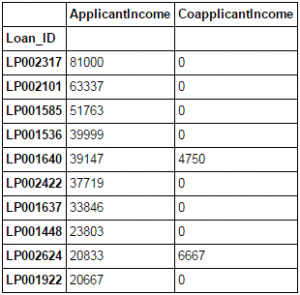
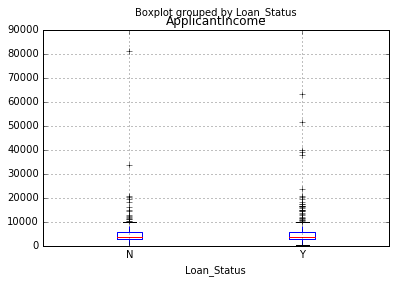
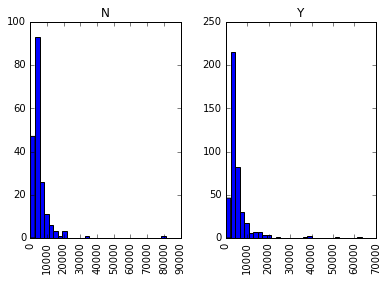
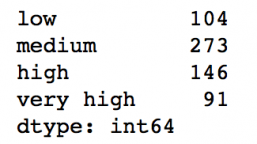
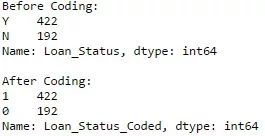
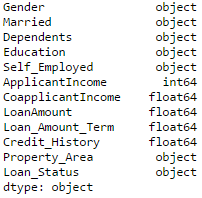
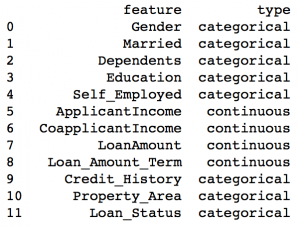
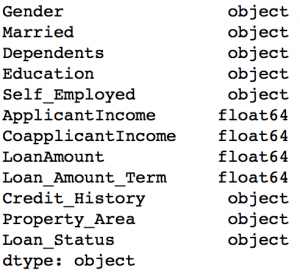
Editor's note: Python is now the language of choice for data scientists, thanks to a well-developed programming language ecosystem and a better scientific computing library. If you are starting to learn Python, and the goal is data analysis, I believe NumPy, SciPy, Pandas will be a necessary magic weapon on your way. Especially for mathematics professionals, Pandas can be used as a first choice for data analysis. This article will introduce 12 Pandas techniques for data analysis. In order to better describe their effects, here we use a data set to assist in operations. Datasets: The subject of our research is loan forecasting. Please download data (registration required) at datahack.analyticsvidhya.com/contest/practice-problem-loan-prediction and start a learning journey. preparation! Start! First, we first import the module and load the dataset into the Python environment: Import pandas as pd Import numpy as np Data = pd.read_csv("train.csv", index_col="Loan_ID") 1. Boolean Indexing In the table, if you want to filter the value of the current column according to the conditions of another column, what would you do? For example, suppose we want a list of all females who have not graduated but have applied for a loan. What is the specific operation? In this case, Boolean Indexing, or Boolean indexing, provides the appropriate functionality. We just need to do this: Data.loc[(data["Gender"]=="Female") & (data["Education"]=="Not Graduate") & (data["Loan_Status"]=="Y"), ["Gender ","Education","Loan_Status"]] 2. Apply Function The Apply function is one of the most commonly used functions that use data and create new variables. After applying some function to a specific row/column of DataFrame, it will return the corresponding value. These functions can be either default or user-defined. Here we define a function to find missing values ​​in each row/column: #Create a new function: Def num_missing(x): Return sum(x.isnull()) #Applying per column: Print"Missing values ​​per column:" Print data.apply(num_missing, axis=0) #axis=0 defines that function is to be applied on each column #Applying per row: Print"Missing values ​​per row:" Print data.apply(num_missing, axis=1).head() #axis=1 defines that function is to be applied on each row We got the expected result. One thing to note is that here the head() function works only on the second output because it contains multiple rows of data. 3. Replace missing values For replacing missing values, fillna() can be in one step. It will use the mean/mode/median of the target column to update the missing values ​​for this purpose. In this example, let us update the missing values ​​of the columns Gender, Married, and Self_Employed using the mode number: #First we import a function to determine the mode From scipy.stats import mode Mode(data['Gender']) Output: ModeResult(mode=array(['Male'], dtype=object), count=array([489])) We got the mode and the number of times it appeared. Remember that many times the mode is an array because there may be multiple high frequency words in the data. By default, we will select the first one: Mode(data['Gender']).mode[0] *'Male' Now we can update missing values ​​and detect our own knowledge of the Apply function: #Impute the values: Data['Gender'].fillna(mode(data['Gender']).mode[0], inplace=True) Data['Married'].fillna(mode(data['Married']).mode[0], inplace=True) Data['Self_Employed'].fillna(mode(data['Self_Employed']).mode[0], inplace=True) #Now check the #missing values ​​again to confirm: Print data.apply(num_missing, axis=0) From the results point of view, the missing value is indeed made up, but this is only the most primitive form. In the real work, we also need to master more complicated methods, such as grouping the use of average/mode/median, pair of missing Values ​​are modeled and so on. 4. Pivot Table Pandas can be used to create MS Excel-style Pivot Tables. In the example in this article, the key column of the data is "LoanAmount" with missing values. In order to obtain a specific number of loan lines, we can use the loan statuses of Gender, Married, and Self_Employed to estimate: #Determine pivot table Impute_grps = data.pivot_table(values=["LoanAmount"], index=["Gender","Married","Self_Employed"], aggfunc=np.mean) Print impute_grps 5. Multi-Indexing If you look closely at the output of the section “Replace Missing Valuesâ€, you may find that a strange phenomenon is that each index is a combination of 3 values. This is called Multi-Indexing and it facilitates the fast execution of operations. Let us follow this example. Suppose now that we have values ​​for each column, but we have not made missing value estimates. At this time, we must use all the previous skills: #iterate only through rows with missing LoanAmount For i,row in data.loc[data['LoanAmount'].isnull(),:].iterrows(): Ind = tuple([row['Gender'],row['Married'],row['Self_Employed']]) Data.loc[i,'LoanAmount'] = impute_grps.loc[ind].values[0] #Now check the #missing values ​​again to confirm: Print data.apply(num_missing, axis=0) Note: Multi-indexing requires a tuple to define the index group in the loc statement. This is a tuple to use in the function. The suffix of values ​​[0] is required because the value returned by default does not match the value of the DataFrame. In this case, direct allocation will be wrong. 6. Crosstab This function can be used to shape the initial "feeling" (overview) of the data. In layman's terms, we can verify some basic assumptions. For example, in the loan case, "Credit_History" will affect the success of personal loans. This can be tested with Crosstab as follows: Pd.crosstab(data["Credit_History"],data["Loan_Status"],margins=True) If the value is not intuitive enough, we can use the apply function to convert it to a percentage: Def percConvert(ser): Return ser/float(ser[-1]) Pd.crosstab(data["Credit_History"],data["Loan_Status"],margins=True).apply(percConvert, axis=1) Obviously, people with "CreditHistory" have a greater chance of getting a loan, with a probability of more than 80%, while those without "CreditHistory" have a poor chance of getting a loan of 9%. But is this a simple forecast result? No, there is an interesting story here. People with known CreditHistory†are more likely to get a loan, so we can set their “LoanStatus†to Y and others to N. What is the forecast result of such a model? We performed 614 times Tested, and its correct prediction number is 82+378=460, 75% accuracy! Maybe you'll be tempted to ask the question why you need to pull in the statistical model. I do not deny, but I just want to make it clear that if you can improve the accuracy of this model by even 0.001%, this is a huge breakthrough. Note: 75% here is an approximate value, and the specific number is different in training set and test set. I hope this can intuitively explain why a 0.05% increase in accuracy in a match like Kaggle can result in more than 500 rankings. 7. Merge DataFrame When we need to integrate information from different sources, it's important to merge DataFrames (or do you love to say data frames). Housing prices are very hot now, and real estate speculators are also very hot, so we first use the data set data to assume a table of different average housing prices (1 level) in each region: Prop_rates = pd.DataFrame([1000,5000,12000],index = ['Rural','Semiurban','Urban'],columns = ['rates']) Prop_rates Now we can merge this information with the original DataFrame to: Data_merged = data.merge(right=prop_rates, how='inner',left_on='Property_Area',right_index=True, sort=False) Data_merged.pivot_table(values='Credit_History',index=['Property_Area','rates'], aggfunc=len) Can not afford to buy anyway, well, the data merged successfully. Please note that the 'values' parameter is not useful here because we only do counting. 8. DataFrame sort Pandas can be easily sorted based on multiple columns as shown below Data_sorted = data.sort_values(['ApplicantIncome','CoapplicantIncome'], ascending=False) Data_sorted[['ApplicantIncome','CoapplicantIncome']].head(10) Note: Panda's sort function is no longer available. Sorting now calls sort_value. 9. Drawing (Boxplot and Histogram) Many people may not know that they can draw box plots and histograms directly in Pandas without having to call matplotlib alone. For example, if we want to compare the distribution of Loan_Status's ApplicantIncome: Import matplotlib.pyplot as plt %matplotlib inline Data.boxplot(column="ApplicantIncome",by="Loan_Status") Data.hist(column="ApplicantIncome",by="Loan_Status",bins=30) These two figures show that the proportion of income in the loan process is not as high as we think. Regardless of whether they are rejected or received a loan, their income is not significantly different. 10. Cut function for binning Sometimes clustered data makes more sense. Take the example of a self-driving car that is frequently hit by recent auto accidents. If we use the data it captures to reproduce the traffic on a road, we can compare it with a smooth day's data or evenly divide the day into 24 hours. The data in the "morning", "afternoon", "evening", "night" and "late night" periods contain more information and are more effective. If we model this data, its results will be more intuitive and overfitting can be avoided. Here we define a simple function that can be efficiently binned: #Binning: Def binning(col, cut_points, labels=None): #Define min and max values: Minval = col.min() Maxval = col.max() #create list by adding min and max to cut_points Break_points = [minval] + cut_points + [maxval] #if no labels provided, use default labels 0 ... (n-1) Ifnot labels: Labels = range(len(cut_points)+1) #Binning using cut function of pandas colBin = pd.cut(col,bins=break_points,labels=labels,include_lowest=True) Return colBin #Binning age: Cut_points = [90,140,190] Labels = ["low","medium","high","very high"] Data["LoanAmount_Bin"] = binning(data["LoanAmount"], cut_points, labels) Print pd.value_counts(data["LoanAmount_Bin"], sort=False) 11. Code for nominal data Sometimes we need to reclassify symmetric name data, which may be due to various reasons: Some algorithms (such as Logistic regression) require that all inputs be numbers, so we need to recode the nominal variable to 0,1...(n-1). Sometimes a category may contain multiple expressions, such as "temperature" can be recorded as "High" "Medium" "Low" "H" "low", where "High" and "H" are the same thing, "Low" and "Low" is one thing, but Python will think they are different. Some categories have very low frequency, so we should combine them. To solve this problem, here we define a simple function that takes input as a "dictionary" and then calls Pandas's replace function to recode: #Define a generic function using Pandas replace function Def coding(col, codeDict): colCoded = pd.Series(col, copy=True) For key, value in codeDict.items(): colCoded.replace(key, value, inplace=True) Return colCoded #Coding LoanStatus as Y=1, N=0: print'Before Coding:' Print pd.value_counts(data["Loan_Status"]) Data["Loan_Status_Coded"] = coding(data["Loan_Status"], {'N':0,'Y':1}) print'After Coding:' Print pd.value_counts(data["Loan_Status_Coded"]) 12. Iterate over the rows of the dataframe This is not a common technique, but if you encounter this kind of problem, I believe no one thinks that you can use your forever loop to walk through all the lines. Here we give two scenarios to use this method: When nominal variable with a number is treated as a number. Numeric variables with characters (because of data errors) on a line are classified as categories. At this point we have to manually define the column's category. Although it is troublesome, but after that if we check the data categories again: #Check current type: Data.dtypes Its output will be: Here we see Credit_History is a named variable, but it is shown as float. A good way to solve these problems is to create a csv file that contains the column names and types. With this, we can create a function to read the file and assign the column data type. #Load the file: colTypes = pd.read_csv('datatypes.csv') Print colTypes After loading this file, we can loop through each row and use the 'type' column to assign the data type to the variable name defined in the 'feature' column. #Iterate through each row and assign variable type. #Note: astype is used to assign types For i, row in colTypes.iterrows(): #i: dataframe index; row: each row in series format If row['type']=="categorical": Data[row['feature']]=data[row['feature']].astype(np.object) Elif row['type']=="continuous": Data[row['feature']]=data[row['feature']].astype(np.float) Print data.dtypes Hope this article is useful to you! We've been around for over 16+ years. We make sure our sound is The Best Sound. Customized Headphones, personalized gifts, promotional products custom , Bluetooth Earphones,Best Headphones TOPNOTCH INTERNATIONAL GROUP LIMITED , https://www.mic11.com

Our products include gaming headset, Bluetooth Earphone, Headphones Noise Cancelling, Best Wireless Earbuds, Bluetooth Mask, Headphones For Sleeping, Headphones in Headband, Bluetooth Beanie Hat, bluetooth for motorcycle helmet, etc
Manufacturing high-quality products for customers according to international standards, such as CE ROHS FCC REACH UL SGS BQB etc.
We help 200+ customers create custom Bluetooth headphones, earbuds, earphones, etc audio products design for various industries.